Question types |
|
Statistical data can be processed for the following question types: |
- For multiple choice questions, Formdesk reports the number of times and percentage each option is chosen.
- For check box questions the percentage and number are displayed for the times the check box has been selected.
- For calculations and numeric entries the average value or the number of times each value occurs is displayed.
- For (long) text entries each unique entry can be displayed along with the number of times it occurs (is not enabled by default, see 'Adding / removing items').
|
|
|
Adding / removing items |
|
By default, multiple choice questions, check box questions, calculations and numeric questions are included in the statistics report. Because this is not always desirable, Formdesk allows you to remove questions from your report.
Text entries as well as non-question items, such as images and text items, can also be added to the report. This can be done while adding / modifying the item: |
 |
|
|
Bar graphs |
|
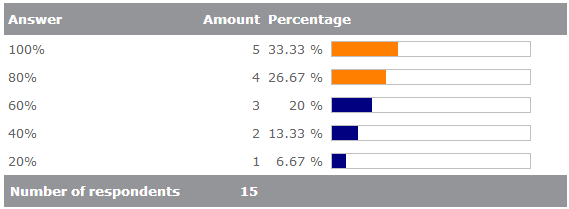
The color of the bar graph changes for each additional 20%. |
 |
|
|
Filters |
Suppose that 84 % of your respondents have a driver's license. Now you’d like to know how many male respondents have a driver's license. This is where a filter can be used.
When a filter is active, only the selected results are used for the statistics report.
Filters are set up and activated on the results overview screen.
|
|
|
Dependencies |
|
Questions that are hidden or disabled using dependencies do not count for the answered questions that the statistics report is based upon. |
|
|
PDF version |
|
Formdesk is able to offer you the statistics report as a PDF file. This file may be used for storage, or to shrink the statistic images to fit your paper size. |
|
|
Publishing statistics |
|
You have the option to share your statistics report on the web for anyone to view. To do so, go to the Settings tab while modifying your form and set the question 'Publish statistics' to Yes. Your statistics report will now be available on www.formdesk.com/your_foldername/your_form?stats. |
|
|
Processing your own statistics |
|
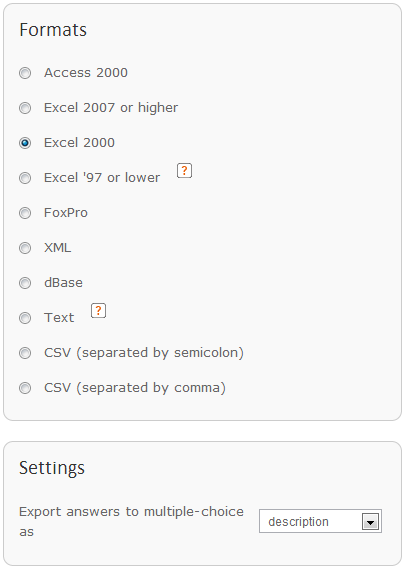
In most cases the statistics report that Formdesk provides will meet your needs. In some cases you might want to go beyond these standard data and graphs. If this is the case, you can import them into a more specialized application such as Excel or SPSS. To do so, you need to download the results from the results overview screen. |
 |
|
|
|
|
|
|
|